Introduction
We have recently come across a scenario where one of our clients changed a configuration in AWS, which stopped AWS Cloud Trail logs from coming through to Microsoft Sentinel. We realised that we didn’t have any robust monitoring in place to identify where specific logs tables might stop sending data. As a security analyst you rarely get time to worry about the things your SIEM tool isn’t alerting you to, such as a drop in data, or log tables disconnecting. Moreover, these aren’t typically the responsibility of an analyst to configure, often falling to the infrastructure or security engineering teams.
So, we needed to come up with a good way to detect these shortages in ingestion so that the appropriate teams are made aware.
The Problem
Whilst this may seem like a relatively straight forward problem to solve, there are a few challenges at play here that throw a spanner in the works.
Problem one – No data by design
The first problem is that some log tables may not receive any data in a day by design.
“What! Surely a log table should always be receiving data.”, I hear you exclaim.
Well, no. I can think of a few edge cases where some data tables don’t receive any data in a given day. For example, a security alert, security incident table or a URL Click table (unlikely but still possible).
Also, think of a log table such as Syslog where you could potentially have multiple data sources feeding into one table. One log source may stop feeding in, but if you set the threshold to zero, you may not notice as the other log sources are still feeding in.
Factoring in this problem, for me it’s inadequate to try and detect a decline in log ingestion by simply saying where no data has been ingested in the last x days. This will surely generate false positive alerts for tables of these types.
Problem two - The ever-moving goalposts.
I’m pretty sure there is a saying:
The three certainties in life are death, taxes and IT systems changing.
I think that’s how it goes anyway.
IT systems change, old systems get replaced, new systems get introduced. New IT systems make for new log tables, and new log tables need to be monitored.
This brings us on to problem number two, how do you design a solution that automatically recognises new log tables? I don’t want to constantly be editing my analytic rule whenever a new log source becomes in scope. Furthermore, I work at an MSSP. I certainly don’t want to be making changes across my whole client base. It’s too much of a management overhead.
It’s better for me, and my sanity, to come up with a solution where I don’t have to do this.
The Solutions
Today I took a trip down memory lane, something that I learnt while doing maths statistics in school (yes I know, who would have thought) helped me solve the ‘no data by design’ problem. That little gem was standard deviation.
We know that we can’t just look for a day where there are no logs received, this may be expected activity. What we can do is take a sum of the data ingested into each data table in a set period of time, and work out the standard deviation that amount of data on a day-to-day basis. Without getting to maths-y, the standard deviation essentially gives us a range of values that we can expect an amount of data ingested, to fall inside of on any given day. This can be represented visually using the graph below:
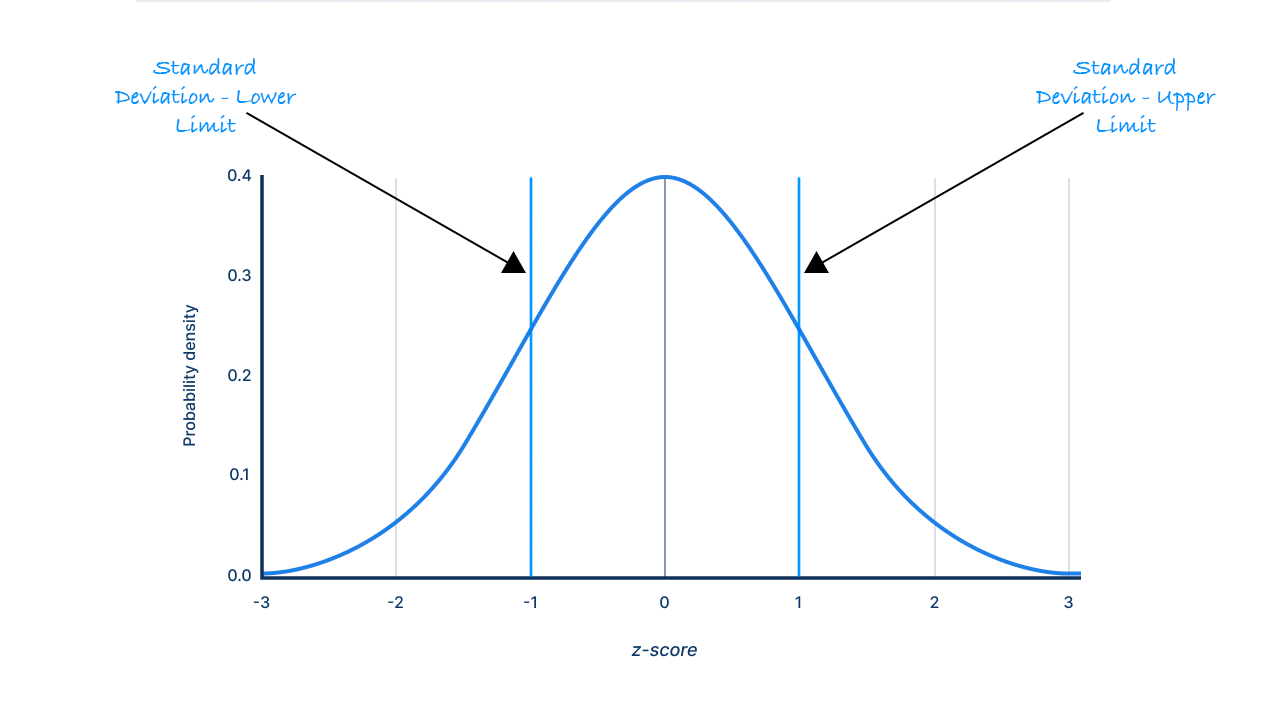
What does is this mean? Well, it means that there is little chance (15.7%), that on a given day, that the amount of data ingested into a log table will fall below the lower boundary (z-score of negative one). I.e., Instead of using zero as my trigger for an alert, I am going to use the lower boundary of the standard deviation, because it’s probably less likely that this will trigger false positives than setting the limit at zero.
Okay but how am I going to make sure I am doing this across every log table every time? This is where Sentinel comes in for us. Sentinel contains a table called Usage. The Usage table keeps a log of all the data coming into Microsoft Sentinel, per data table, per hour. Per-fect.
Note this table is also awesome for reporting. You can make some nice graphs from the data ingestion and use it to work out costs.
The KQL
Finally let’s take a look at the KQL.
1
2
3
4
5
6
7
8
9
10
11
12
13
14
15
16
17
18
19
20
21
22
//Define a threshold for the Minimum Threshold, so this can be adjusted if necessary
let StDevThreshold = 2;
let LowerLimitPerTable = (
    Usage
    | where TimeGenerated > ago(14d)
    # //Work out the matheatical variances we will need per day
    | summarize TotalDataPerDay=sum(Quantity), StandardDeviationPerDay=stdev(Quantity), Average=avg(Quantity) by Day=datetime_part('day', StartTime), DataType
    //Now take the averages of those values over our 14 day period
    | summarize  AvgDataPerTable=avg(Average), AverageStDev=avg(StandardDeviationPerDay) by DataType
    #//use these averages to work out our lower limits
    | extend LowerLimit = (AvgDataPerTable - AverageStDev)
    | extend MinimumThreshold = LowerLimit - (StDevThreshold * AverageStDev)
    | project LowerLimit, MinimumThreshold, DataType, AvgDataPerTable, AverageStDev
);
Usage
| join LowerLimitPerTable on DataType
| where TimeGenerated > ago(1d)
| summarize TotalDataLastDay=sum(Quantity) by DataType, LowerLimit, MinimumThreshold, AverageStDev, AvgDataPerTable
#//Only compare against the lower limit of the standard deviation, i.e. we don't care if more logs are sent in a day
| where TotalDataLastDay <= MinimumThreshold
#//Remove results where the table doesn't fluctuate across a 14 day period, but there is data coming in
| where AverageStDev != 0 and AvgDataPerTable < 0
As mentioned, the usage table gives us a report on how much data is coming into Sentinel per hour, you could stick with this but I have summarised the data by day with the line:
| summarize TotalDataPerDay=sum(Quantity), StandardDeviationPerDay=stdev(Quantity), Average=avg(Quantity) by Day=datetime_part('day', StartTime), DataType
I then get an average across all fourteen days by taking the average of these averages:
| summarize AvgDataPerTable=avg(Average), AverageStDev=avg(StandardDeviationPerDay) by DataType
We can then use this to set the lower limit. I also want to make that lower limit a bit lower in my case, so I have set a value called MinimumThreshold . In my query above I have set the minimum threshold to be two times the standard deviation lower than the mean, but feel free to play around with this in your environment to see what works best for you. This would be the equivalent to the line marked at -2 on the x-axis of the graph above.
At the -2 line there is only a 2.3% chance that the log ingestion would fall below this value. This means that ~2 days in 100 you may expect to see this alert triggering as a false positive.
I.E., if you see this alert trigger, 2.3% of the time it’s going to be fine. There is approximately a 98% chance, something has gone wrong.
Using the let keyword, we create a data table out of the averages for each data table and we store them in a new table called LowerLimitPerTable
Finally, we join this table with our Usage table again and perform the necessary filtering.
Conclusion
In this post we have looked at how we can detect unexpected declines in log tables. It’s important to make sure that the correct data is always feeding into your SIEM solution, so data is available for analysts
We have highlighted potential pitfalls of setting your thresholds to zero when trying to detect this activity. Furthermore, we have spoken about how we can make this rule fully self-sufficient and how it is important to do this to minimise management overhead.
I hope this helps you keep on top of your data connectors! Feel free to message me on Linked In with any questions or improvements. And remember, Keep Calm and KQL!